What is Data Science?
The exact definition of Data Science can be a tad fluid. If you ask two different data scientists, you will get two different answers. The exact topics, skills, and outcomes could be different from person to person. However, the general consensus is that Data Science is the practice of using data to make decisions. This can be done in a variety of ways, but the most common methods are through the use of statistics and machine learning.
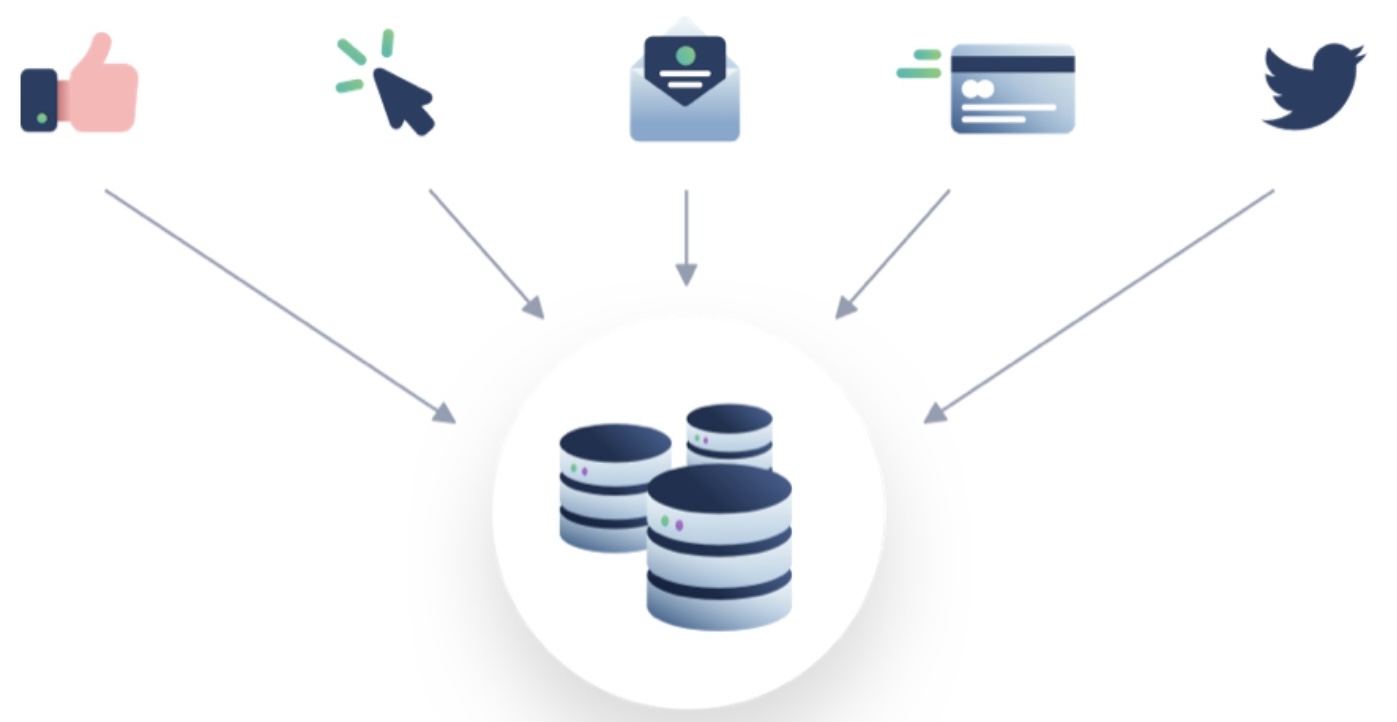
Whether we know it or not, we are giving away tons of data every day. When you “like” a social media post, use a search engine, listen to online music, make an online purchase, or even walk around with your phone, you are giving away data. This data is collected, stored, and analyzed by companies to make decisions. These decisions can be as simple as what ad to show you or as complex as what products to develop.
There are companies that collect data on everything we do. One of the questions we are going to work through this term is how to start analyzing this data. If we are a data scientist, what is the procedure and timeline for analyzing data? What does the typical workflow look like in the field of data science?
Step 1 : Data Collection
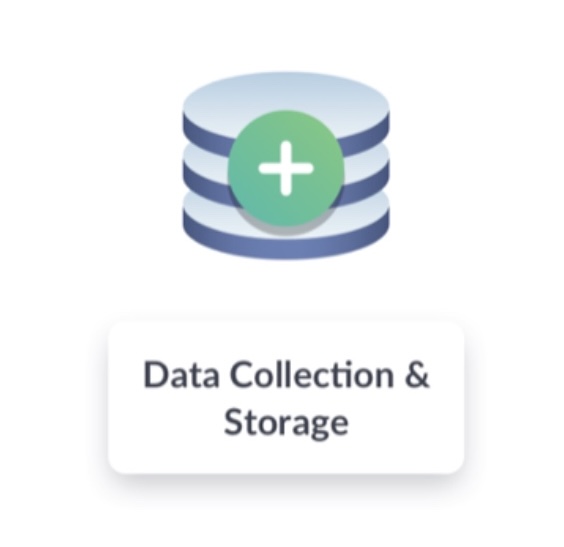
The first step is to collect the data. As was mentioned above, this can be done in a variety of ways. The data can be collected from a variety of sources, some of which are going on and we don’t even know it. The data can be collected from a variety of sources, from the internet, to social media, to smart devices, and even from the government. The data can be collected in a variety of ways, from surveys, to interviews, to observations, to experiments. The data can be collected in a variety of formats, from text, to images, to audio, to video. Once the data collection process is completed, the job of a data scientist is to take this data and find what story it is trying to tell.
Step 2 : Data Preparation
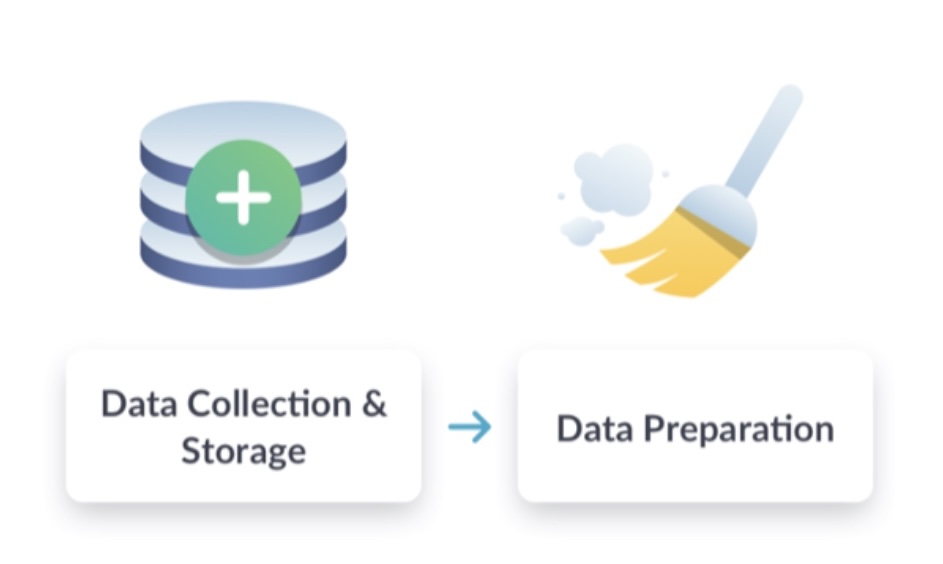
If you talk with someone who is a data scientist, they will undoubtedly tell you that the majority of their time is spent preparing the data. This is because the data is often messy and needs to be cleaned up before it can be analyzed. The data needs to bet set up in a way that the data scientist will be able to analyze it. The data will need to be set up so that it can be analyzed by a script. That means it needs to be prepared (often called “cleaned”) so that the script can read in the data, label the variables, and start the analysis. We are trying to structure the data set so that the script can take in the data and start the anaylsis.
This can be done in a variety of ways, from removing missing data, combining variables, removing duplicates, dealing with outliers, and removing irrelevant data. Once the data is cleaned up, the job of a data scientist is to take this data and find what story it is trying to tell.
Step 3 : Exploration and Visualization
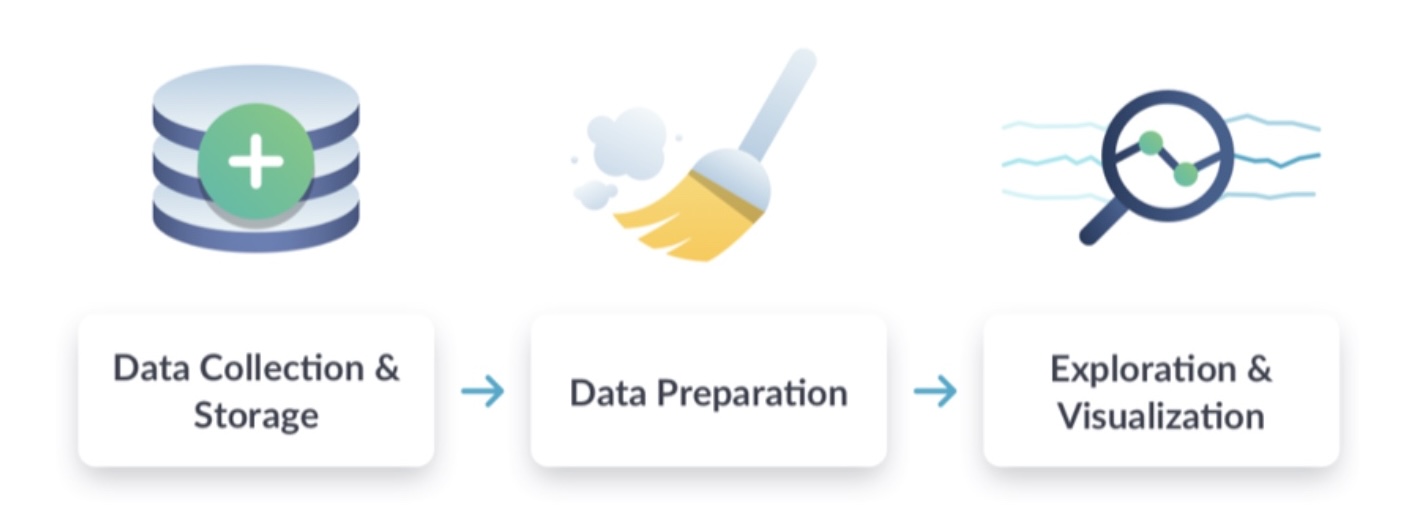
Once the data is cleaned up, the data scientist will start to explore the data. This can be done in a variety of ways, from looking at the data in a table, looking at the data in a graph, or perhaps looking at the data in a map. The data scientist will start to look at the data with many different tools to see what story it is trying to tell.
Traditionally, the data scientist will start by looking at the data in a table or a graph. This initial look at the data will help the data scientist to see if there are any obvious patterns or trends in the data. If there are, then the data scientist will start to explore these patterns or trends in more detail.
For example, conside the story Little Women. The following graph shows the cumulative number of times the names of the main characters are used in the book.
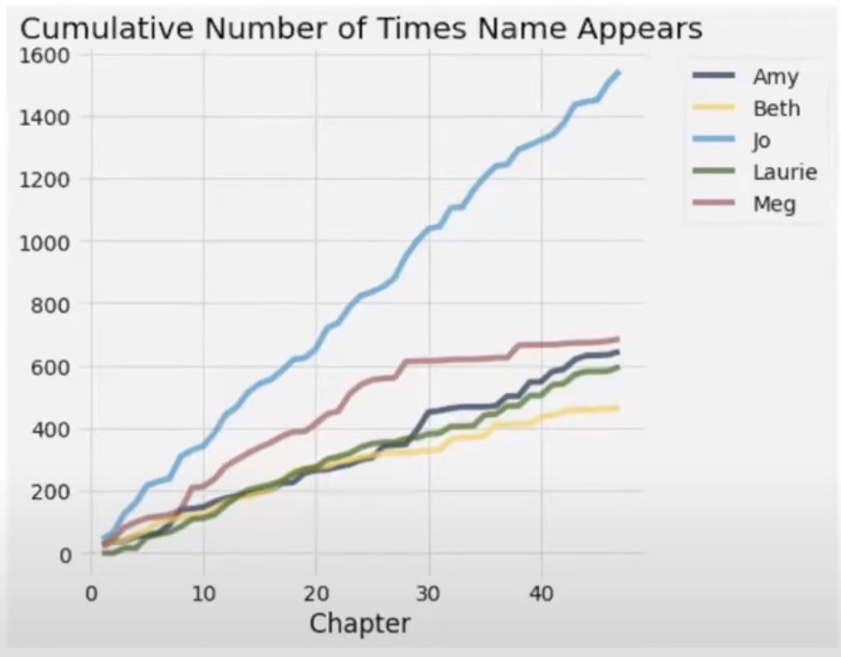
The graph shows that the name “Jo” is used the most, followed by “Meg”, “Amy”, and “Laurie”. If we were going to ask the question of who the main character is in the book, the data would suggest that the protagonist of the story is Jo. Her name appears the most in the book, and it is not very close.While this is an interesting idea to consider, we could also delve a little deeper at this graph. In the story, two of the five characters listed get married to one another. Based on this graph, can we hypothesize as to whom those two people might be?
Based on the graph, we could hypothesize that Amy and Laurie get married. If we examine the graph, we can see that the pattern for the number of times Amy appears in the book is very similar to the pattern for the number of times Laurie appears in the book starting around chapter 35. This could suggest that the two of them are in several scenes at the same time and when one is mentioned, then the other is also there. Thus they are starting to spend more time together.
This proves to be true as Amy and Laurie get married in chapter 44.
Step 4 : Experimentation and Prediction
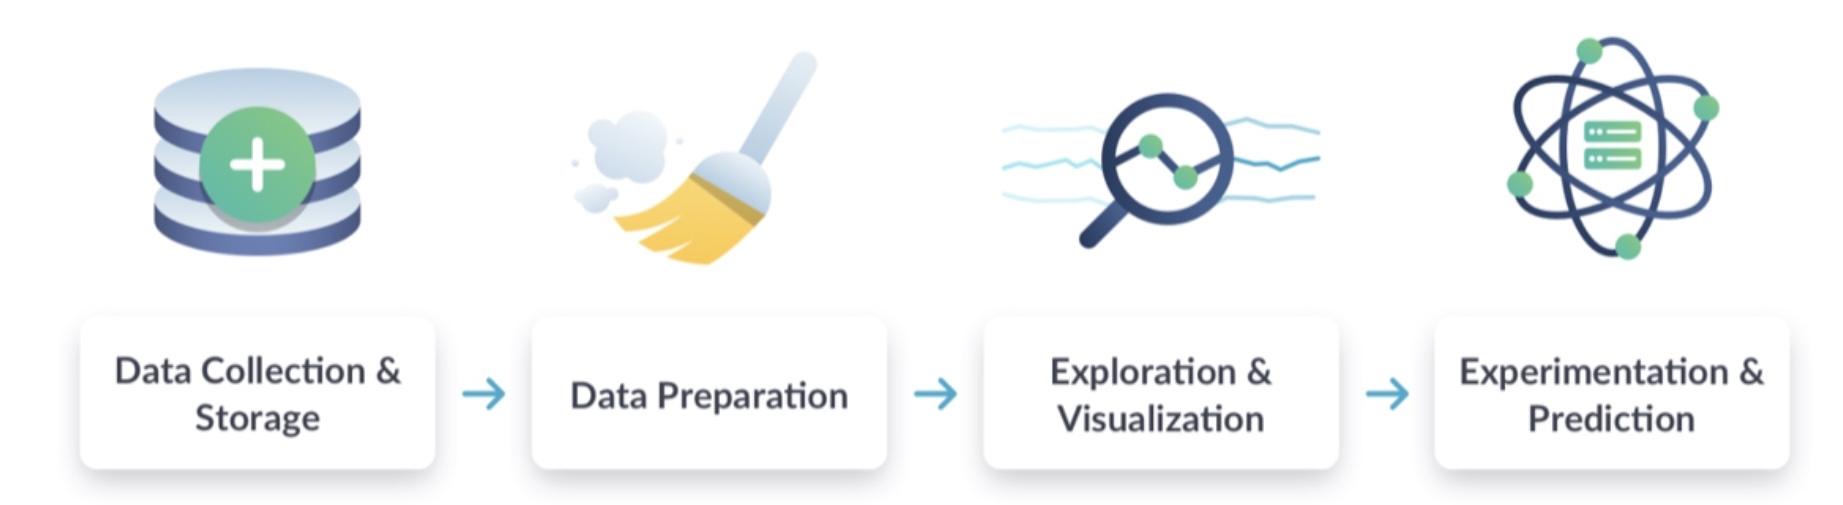
One of the goals of a data scientist is to take data and try to figure out what comes next.
- Is a stock going to rise or fall?
- Is a virus going to continue to spread or die out?
- Is a customer going to buy a product?
These are all questions that a data scientist will try to answer. We are now at the stage of trying to make predictions based on the data that we have collected, cleaned, and explored. A data scientist will make a “Model” that will try to predict what comes next. When we say “model”, are really saying a mathematical equation that represents the data set. This model will be used to make predictions about the future. There are several ways to make a model, but this course will focus primarily on what is know as “linear regression”. This is a beginning modelling technique that will introduce you to the modelling concept and get you started on the path to making predictions.
Learning Goals
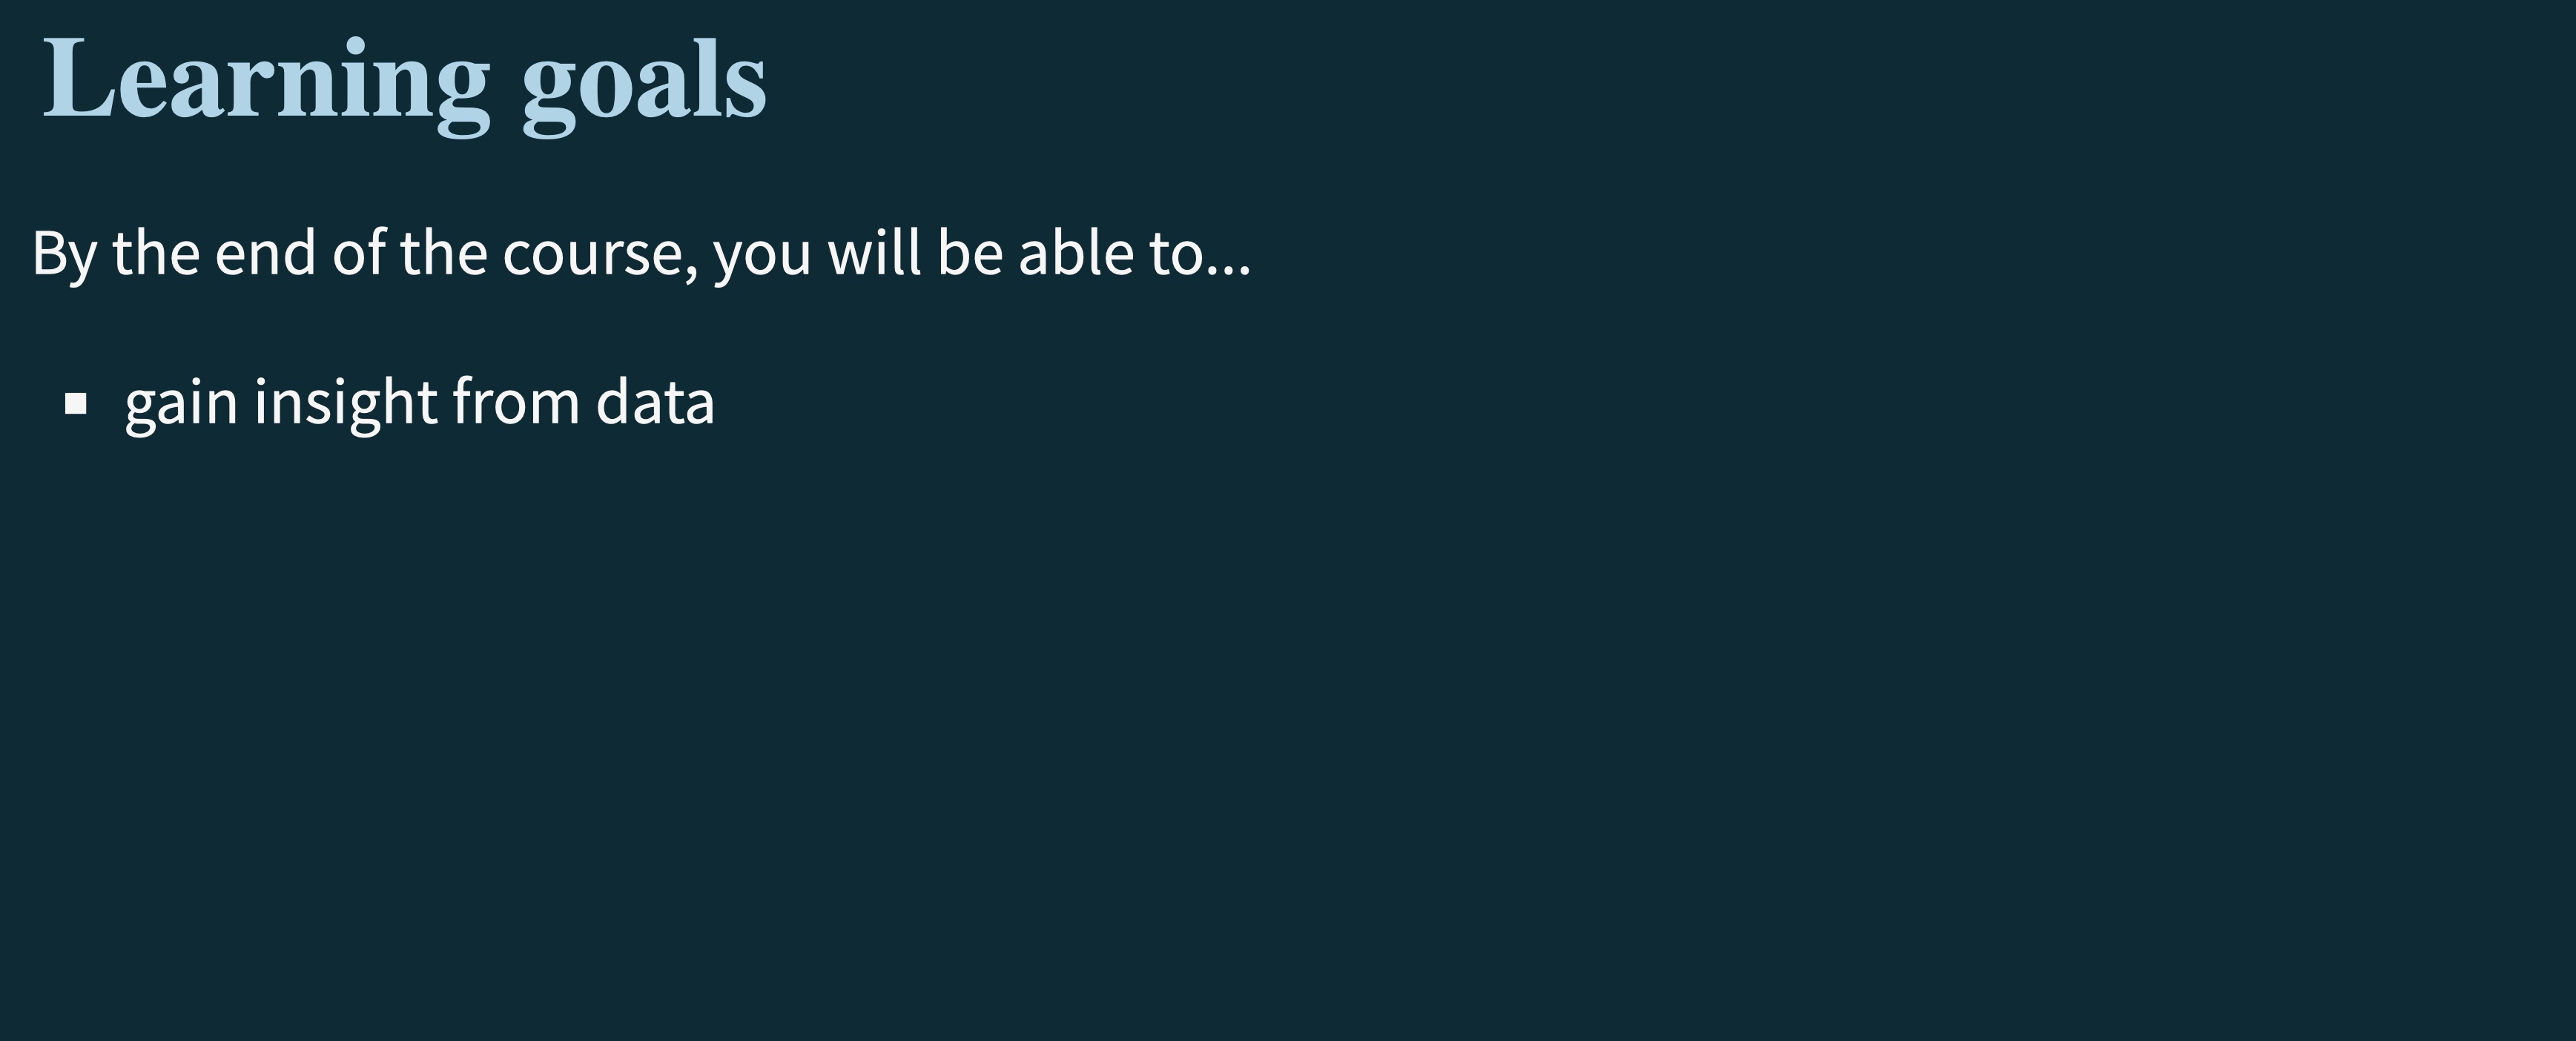
As we walked through above, one of the main goals of this course is for you to be able to take in a data set and find some story that it is trying to tell. In other words, what insights can you pull out of a data set?
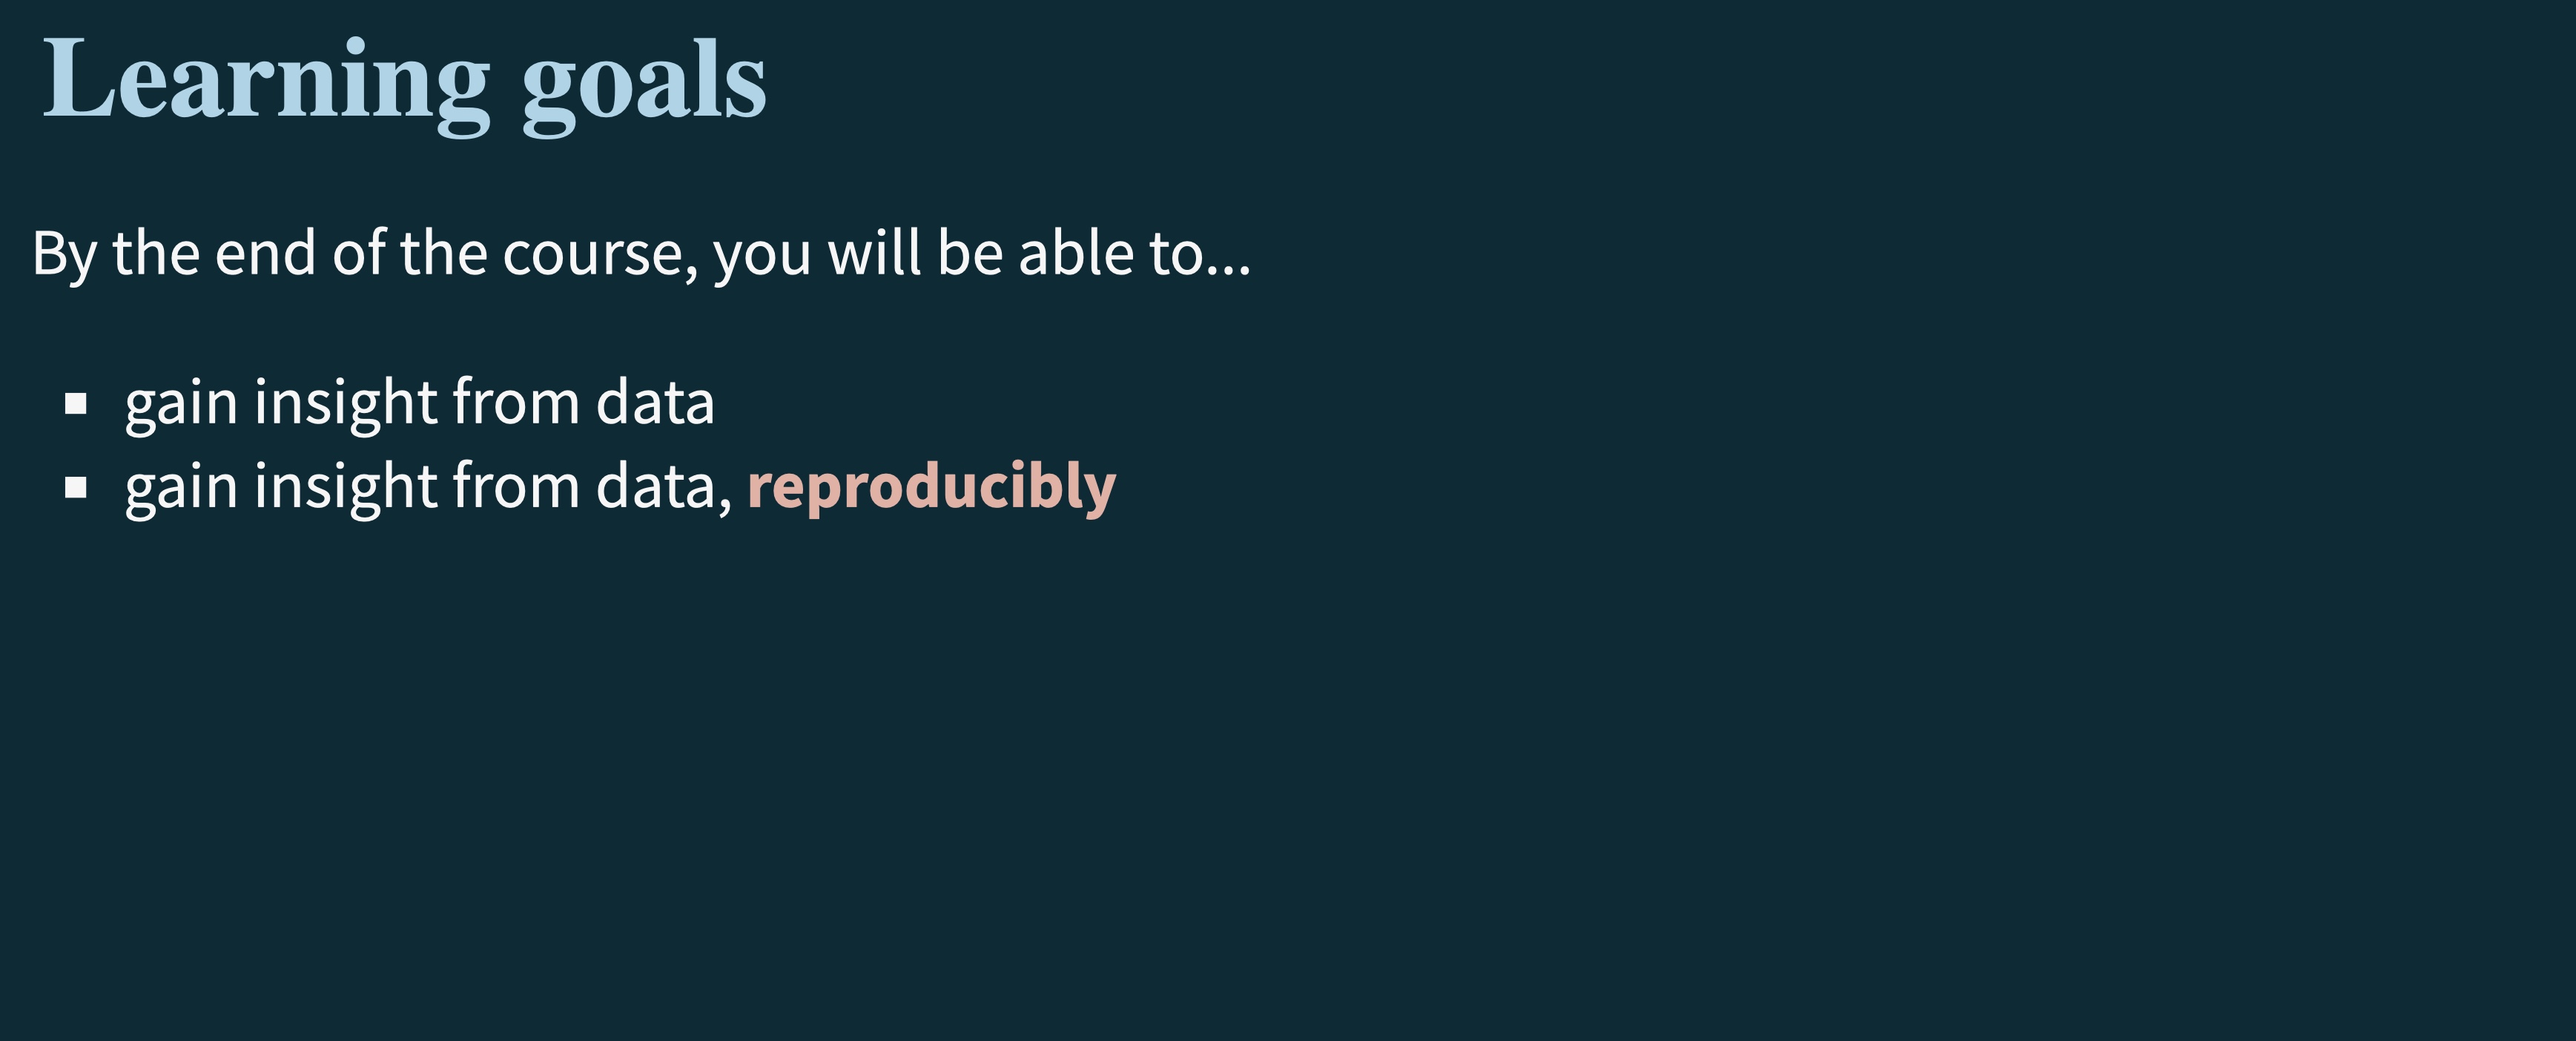
If a data scientist, or any scientist for that matter, wants their work to be taken seriously, then it needs to be reproducible. This means that if you were to take the data set and the script that was used to analyze the data, you should be able to get the same results. This is a big part of the scientific method. If you can’t reproduce the results, then the results can not be considered reliable or valid.
For our consideration, what does it mean for work to be “reproducible”?
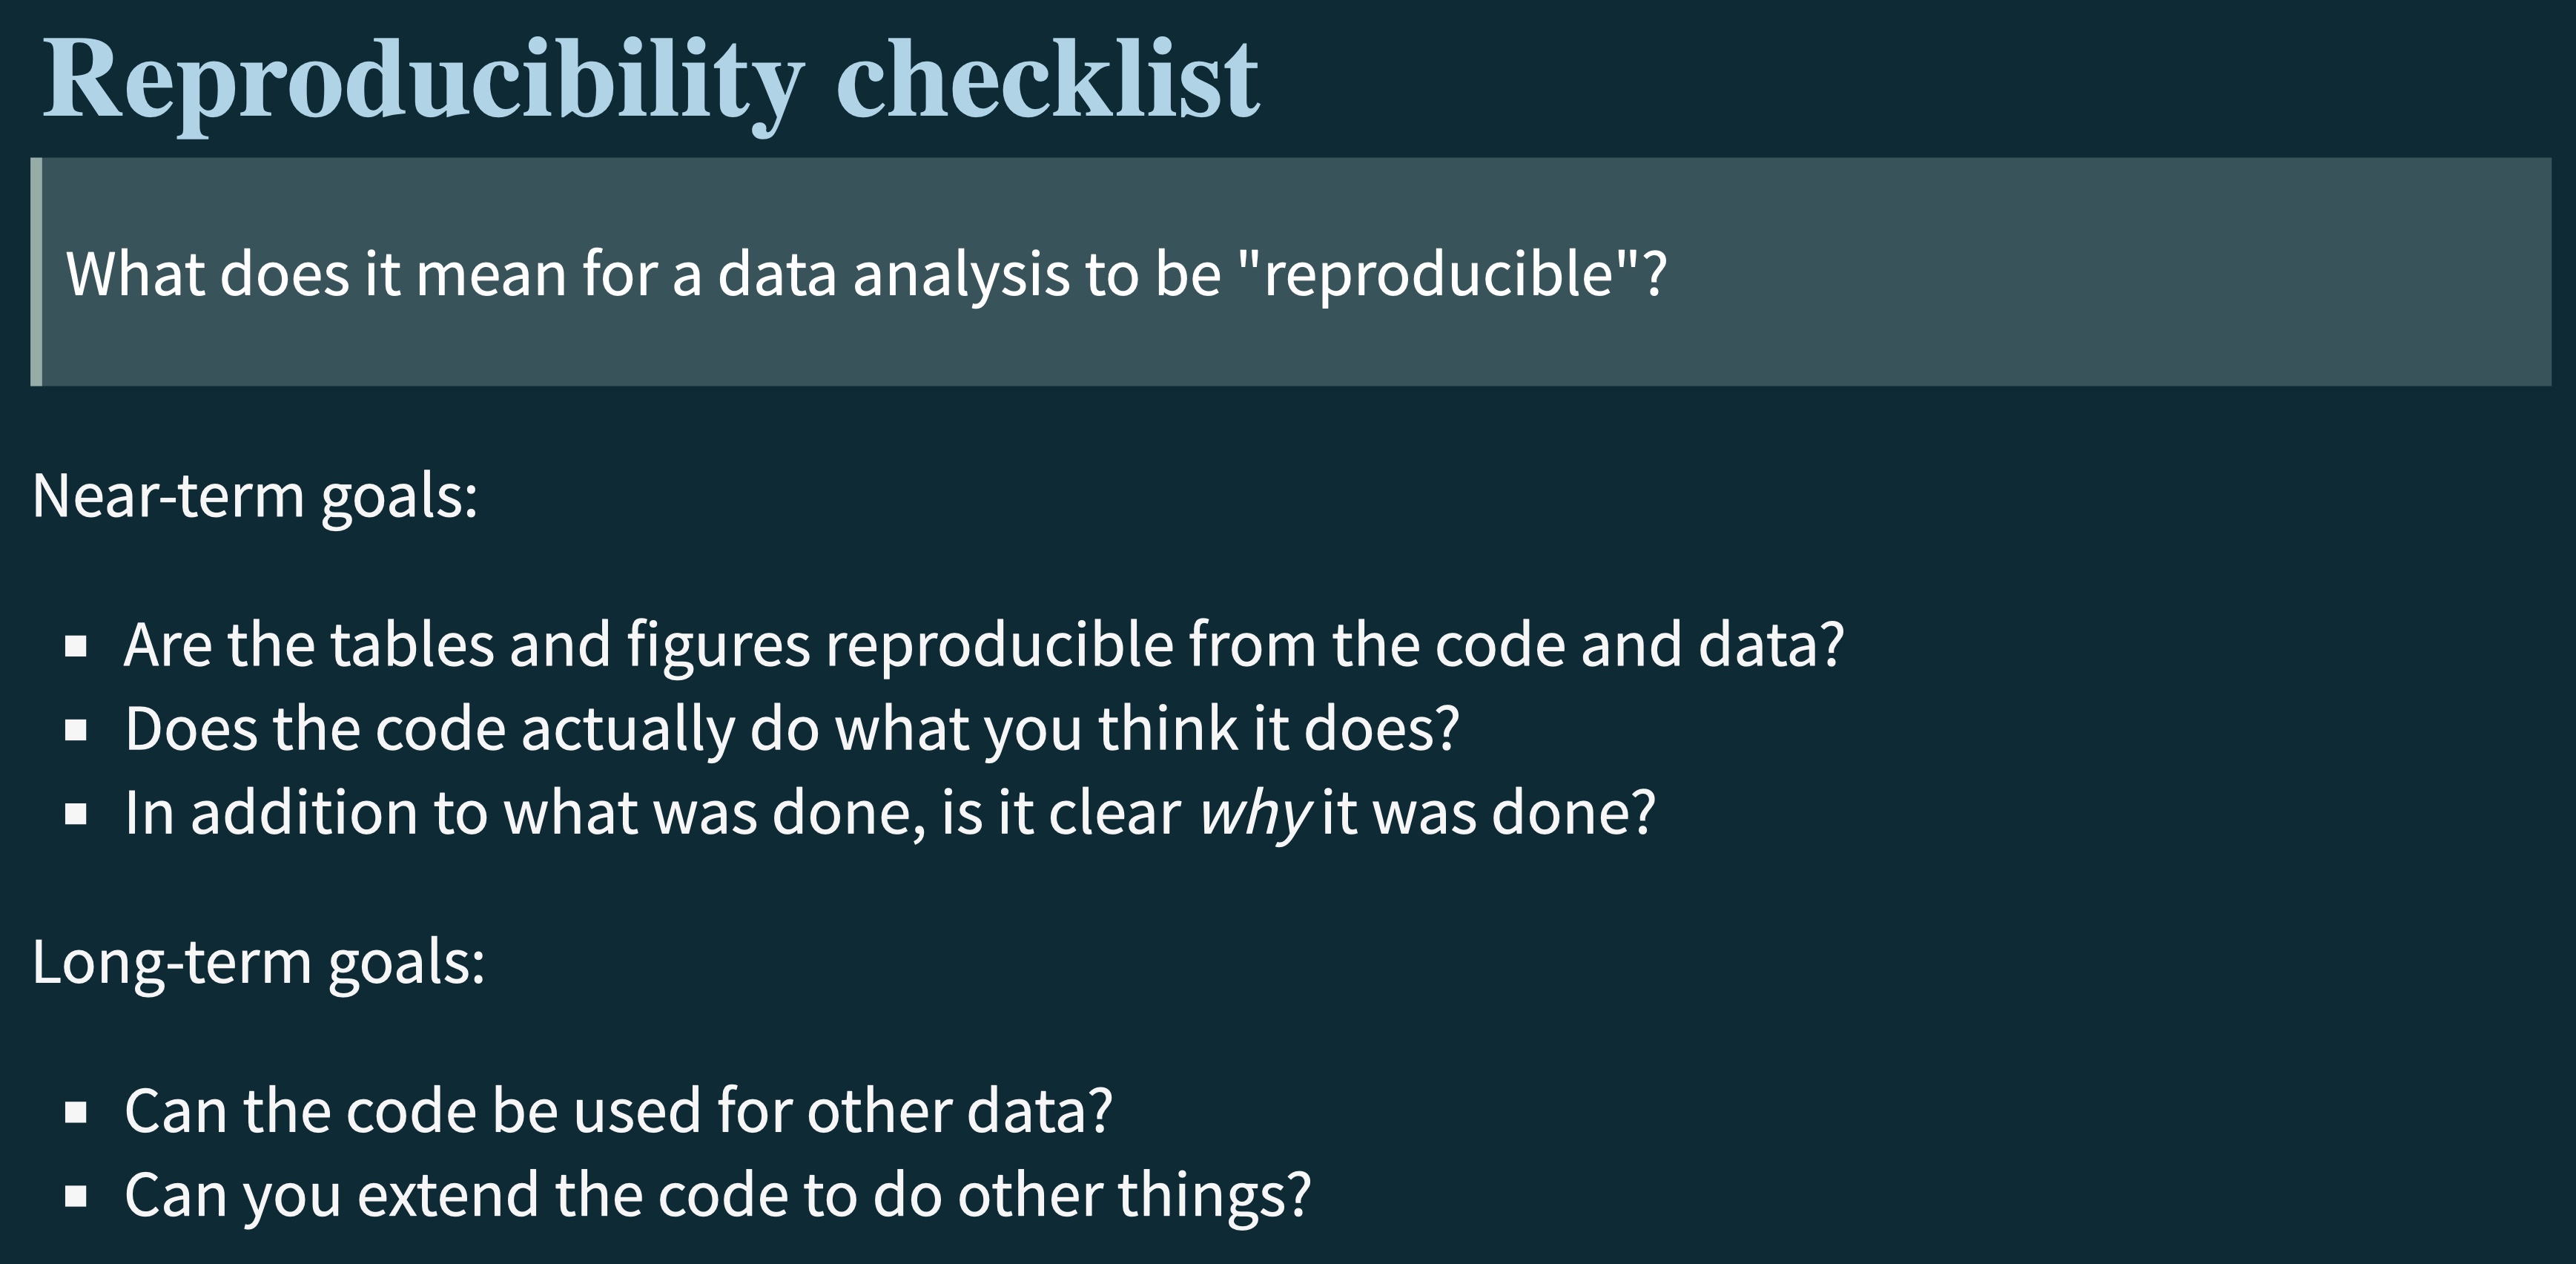
In the graphic above, the near-term goals show you what to consider for the project in which you are currently working. The long-term goals show you what you should be thinking about for the future as you are working on you current project.
You don’t want to be always “recreating the wheel”. Can you write code that can be adapted to other data sets easily? Can you write code that you, or someone else, could modify to find a different story in your data set or in a different data set?
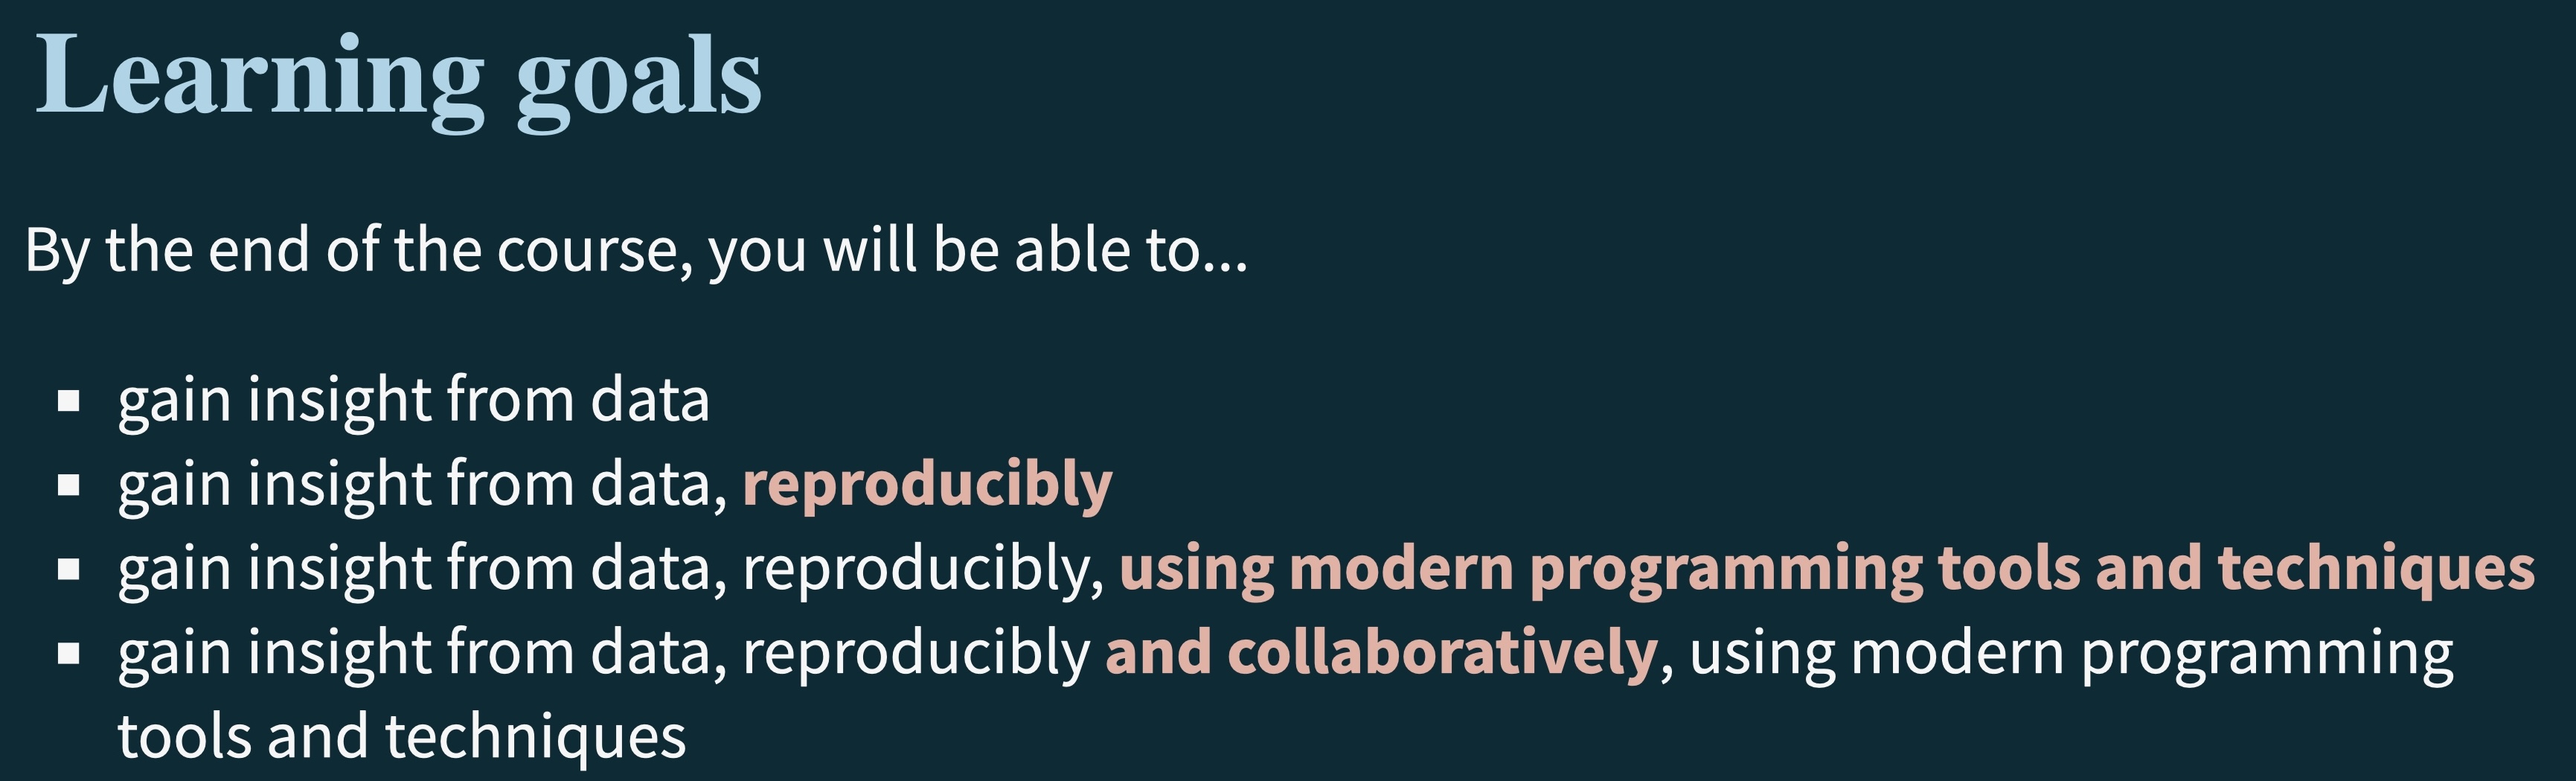
The final two learning goals we will discuss will be working collaboratively and using the same tools as used by data science professionals. As you will hear from some of our data scientist guests, they are almost always working with a group. This group analyses the data, creates the visualizations, writes code, and finalize reports together. Being able to work with and listen to others is a skill that can help you become a better data scientist, better communicator, and better team member.
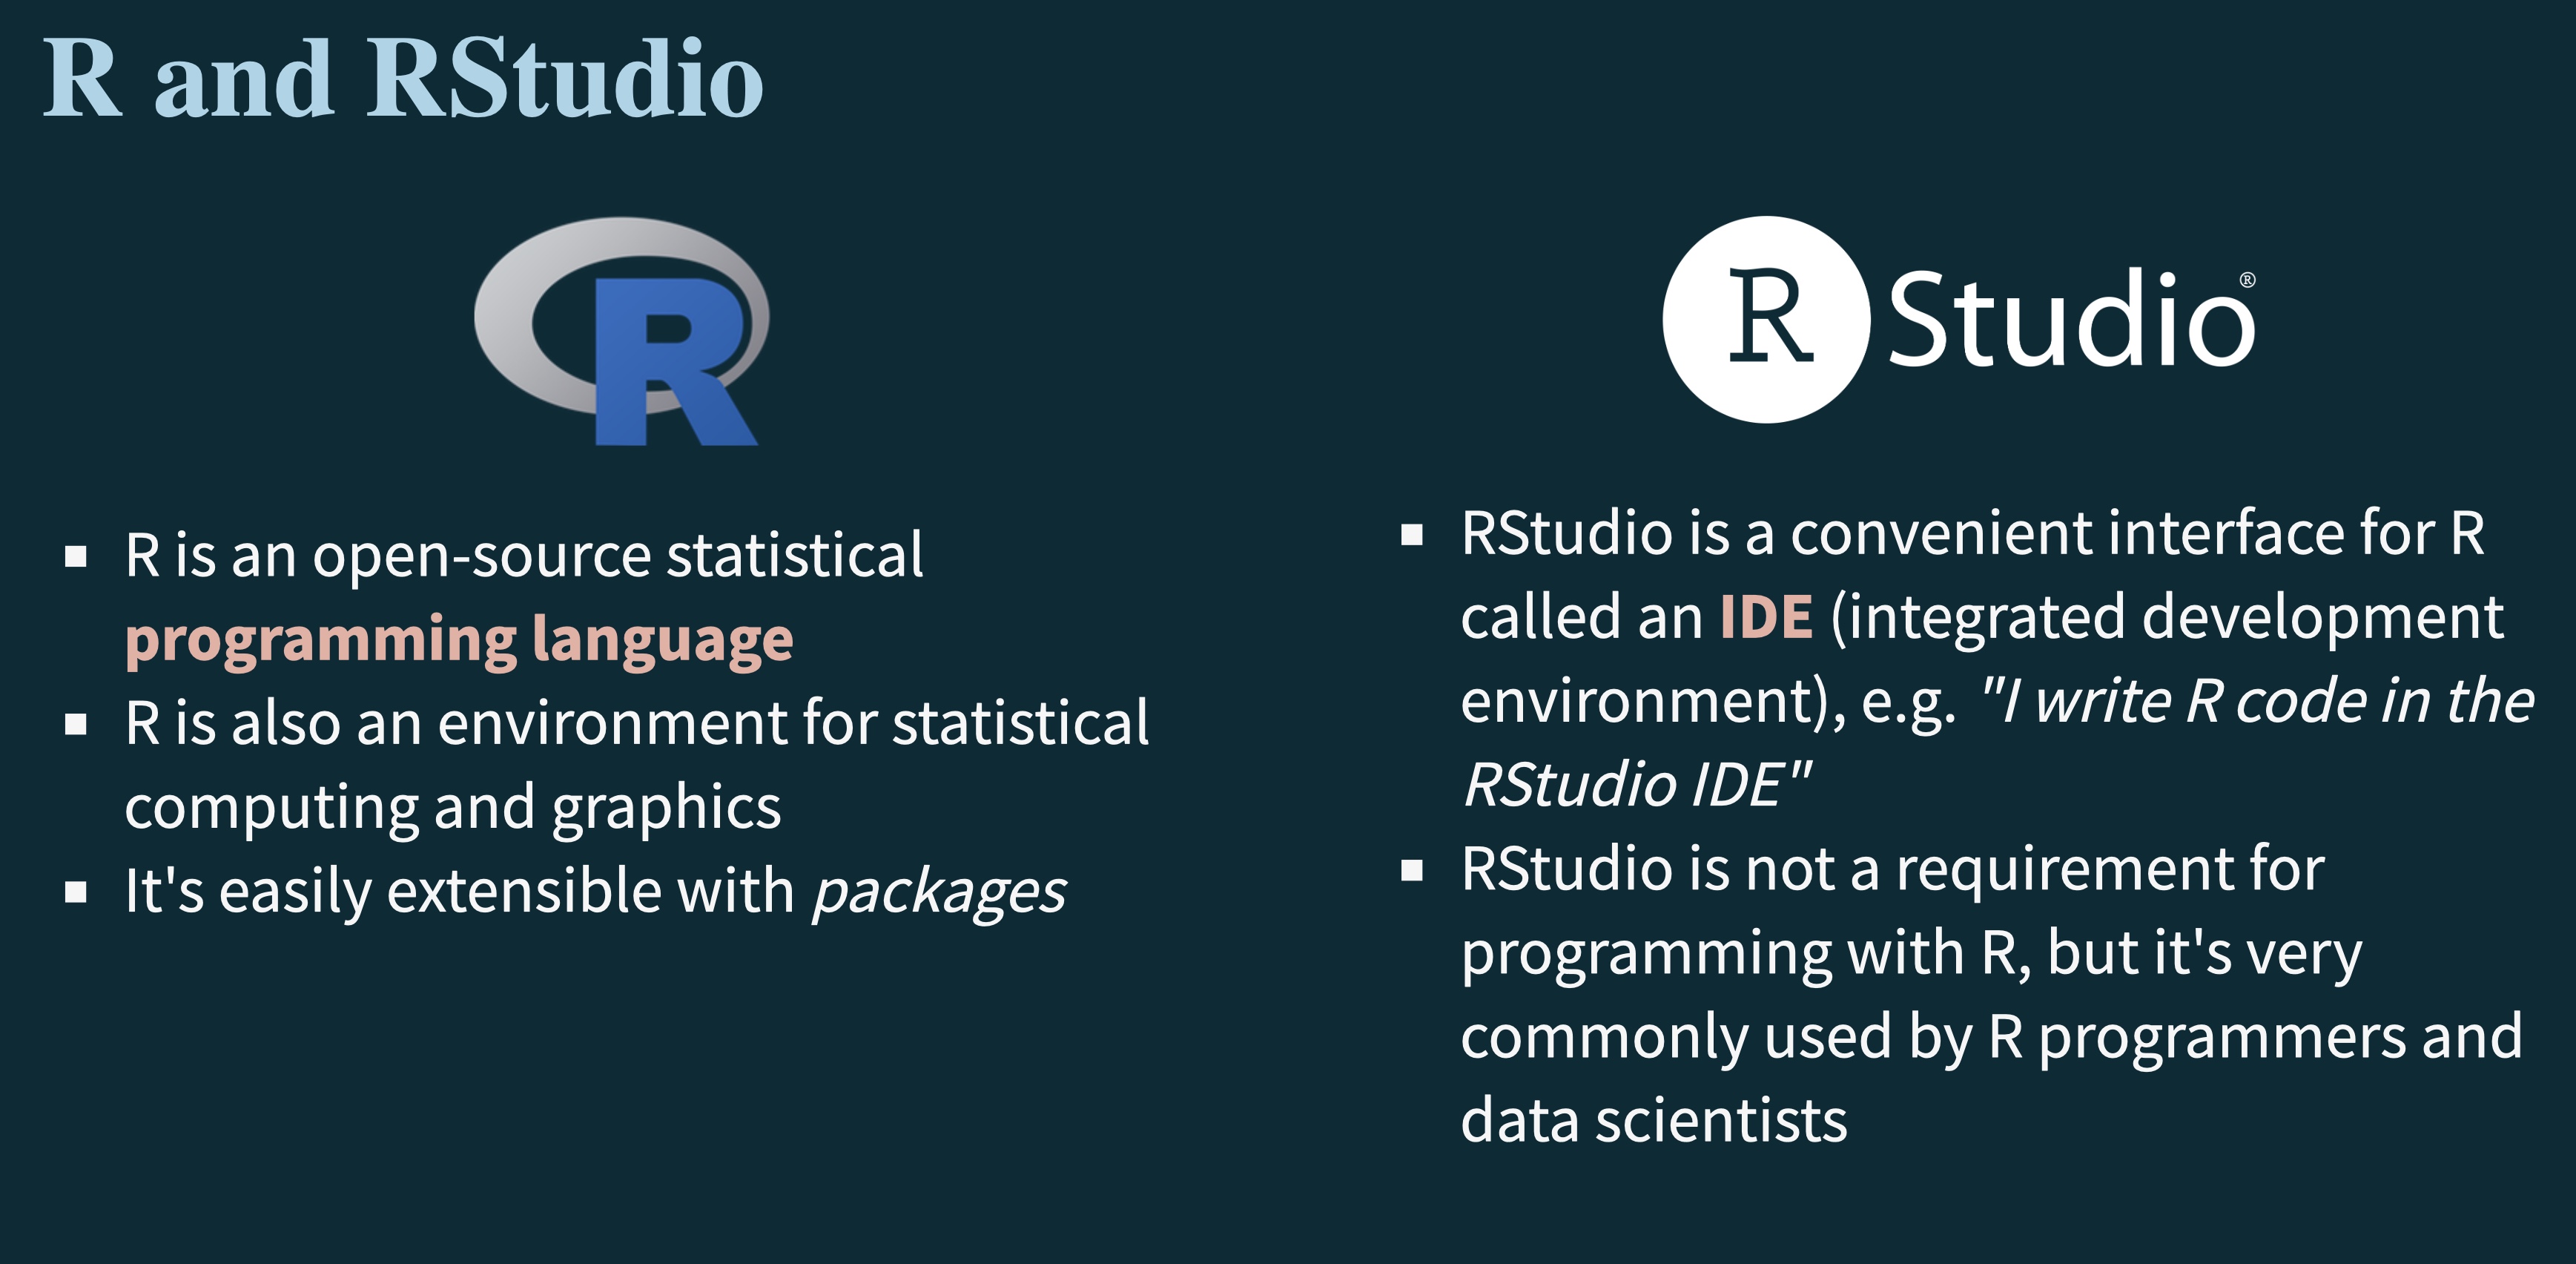
When it comes to tools for data analysis, the industry standards are R and Python. These are the two most common programming languages used by data scientists. Academic or scientific research is often done in R, while industry research is often done in Python. If you are going to be a data scientist, you will need to know how to use these tools. This course will focus on R, but do not worry if you are worried about not using python. The two languages are very similar and if you know one, the other is not too difficult to learn.