Independent and Dependent Variables
In our studies so far, we have been analyzing variables through visualizations and EDA. As we have been doing this, we have been examining one variable at a time. We might find an average of a test, poverty levels in a county, or could be investigating another question. We now want to turn our attention to the idea of if two variables have some type of relationship.
When we talk about the relationship between two variables, what we are really asking is if the behavior of one variable affects the behavior of another variable. For example, we might want to ask questions such as these :
- If a student studies more, then will their test score go up?
- If the temperature reaches a certain level, then will a plant grow more?
- If a company spends more money on advertising, then will sales increase?
When examining the questions above, it is easy to see that we are saying that one variable is directly affecting a different variable. Consider the first example. It seems to make sense that if a student studies more for a test, then they should see an increase in their test score. In other words, as the amount of time studying changes, then the resulting score on a test should change, too. Thus study time is affecting test score.
If we are in a situation where variable X is causing a change in variable Y, then we will label variable X is the independent variable and variable Y as the dependent variable. You can think of this as a cause and effect relationship. The independent variable is causing the effective change in the dependent variable. Note that some texts also call the independent variable the explanatory variable and the dependent variable the response variable. This is because the independent variable is the explanation for the change and the dependent variable is responding to the change in the independent variable.
While it is possible to hypothesize that two variables are related to one another, it can be quite difficult to prove this. Consider the first example again. Does studying for a test cause an increase in the test score? Assume student A studies for 4 hours before test 1 and then studies for 6 hours before test 2. If Student A score 10 points higher on test 2, can we attribute the success solely to the amount of time studied? After all, there are other circumstances that could have helped as well.
- Perhaps student A didn’t sleep well before test 1 and got more rest before test 2?
- Perhaps the material on test 2 was what student A studied more?
- Perhaps student A was feeling ill during test 1 and that affected the score.
- Perhaps there is another factor that we don’t even know about affecting the test scores.
When trying to determine if there is a relationship between two variables, here are three models we will consider using to describe the relationship.
Causation
The causation model is the one that researchers are always hoping for. This is the model to where there is a direct cause and effect relationship between two variables. In other words, the change in the dependent / response variable Y is only because of the independent / explanatory variable X. Consider the following graphic :
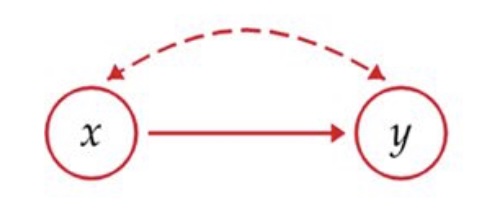
The way you can interpret this graphic is as follows. A researcher wonders if variable X causes a change in variable Y The researcher then takes in some data and from the data it looks like there is a relationship between the two variables. This is denoted by the dashed arrow. This dashed arrow is telling us that their appear to be some type of association between the variables. As it turns out, variable X is the only variable causing a change in variable Y This is represented by the solid arrow in the graph.
This tells us that if there is a direct cause and effect relationship between two variables with no other variables being the cause for change, then this is the causation model.
Common Response
Examine this graphic for the common response model.
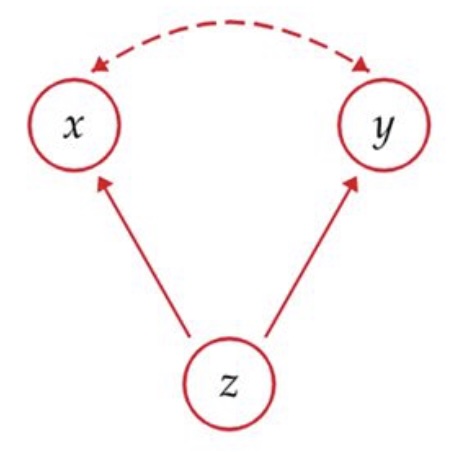
This model starts off similarly as the previous one. Our researcher questioned an association, took in some data, and based on the data it looks like there could be an association between the two variables. That is what the dashed arrow represents. However, this is when the story starts to change.
When it looks like there is an association this means that as variable X (the explanatory variable) changes, it appears to be causing a change in variable Y (the response variable). What is really happening is that a new player has come into the picture, the variable Z. If you look at the graphic, variable Z is causing a change in variable X and variable Y at the same time. So while it looks like X is changing Y, it is the case that X is not affecting Y at all and Z causing the change between both of them. Therefore the association that we are seeing is because of the common response both X and Y are having to Z.
In a situation such as this, variable z is called a lurking variable. This is a variable that is affecting our study that we are not accounting for when examining the relationship between X and Y.
Confounding
Our last model looks like this :
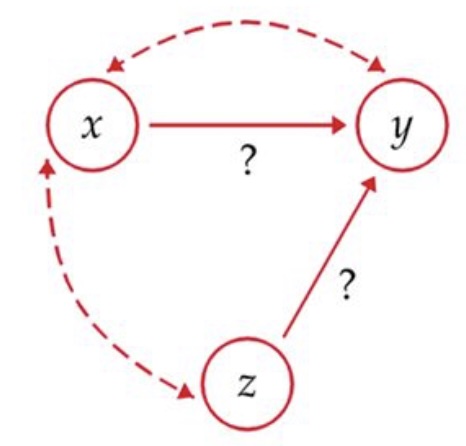
Our story starts the same as the first two models. We investigate a relationship and based on the data, it appears there is an association between variable X and variable Y (dashed arrow). As you can see, we have a lurking variable, Z, that is complicating the analysis. From the second dashed arrow, there appears to be some type of association between X and Z. What we can see from the solid arrows is that X and Z are both changing Y at the same time! The question we can’t tell from this model is how much of the change in Y we can attribute to X and how much we can attribute to Z.
Since we can’t determine how much of the change in Y is attributable to X, we don’t know if the association is strong or not. It could be X driving the change in Y or it could be Z driving the change. Since we can’t determine these levels, this model is called confounding.
Association is not Causation
As the models have shown us, just because it looks like there is an association between two variables, this is not evidence that there is a cause and effect relationship between the two variables. Based on the models above, there could be anything from a 100% relationship (causation) to a 0% relationship (common response), with the truth likely being someplace in between (confounding).
The term “association” is often times replaced with the word “correlation”. This leads us to and defines a phrase you have probably heard many times when it comes to using statistics :
Correlation does NOT imply Causation
Showing Causation
Showing that there is a direct cause and effect relationship between two variables is not easy to prove. Let’s assume that we have made a hypothesis about two variables, collected data, done some analysis, and it appears that there could be an association between the two variables. What is need next are steps that can show the association is valid. To prove causation in statistics, there are three concepts that we must verify : temporal precedence, covariance, and the absence of confounding variables.
Temporal Precedence
This is a fancy way to say that the cause must come before the effect.
If a researcher wants to see if a change in Variable X causes a change in variable Y, then the researcher will force a change in X and then observe what happens to variable Y. If there really is a relationship, then the researcher will see a change in Y only after there has been a change in X. If the variable Y changes before we do anything to variable X, then that is evidence that a lurking variable has come in to the experiment.
Covariance
Covariance is a statistical measure that one can use to measure how two variables change in relationship to one another. While we won’t be using this in this course, it is worth understanding what it means.
When a researcher calculates the covariance between two variables, the resulting value describes the relationship between the them. If the covariance is a positive value, then the two variables tend to increase together or decrease together. In other words, as the independent variable increases, so does the dependent variable and vice versa. If the covariance returns a negative value, then the variables have an inverse relationship. This tells us that if the independent variable increases, then the dependent variable decreases and vice versa.
As the value of the covariance moves further and further away from zero implies that the relationship between the two variables is getting stronger. If the covariance has a value close to zero then this is evidence that there is not much of an association between the two variables.
Absense of Confounding Variables
The last concept to consider is finding a way to remove the effect of confounding variables. As a researcher you want to see if a single variable X is causing the change to a variable Y. If there are confounding variables that could be changing both, then there is not a way for us to determine how much of the change is Y we can attribute to X. The only way we could measure this is if we can rule out any other possibility explaining the change in Y. In other words, if we remove all of confounding variables from the equation, the only variable that could be causing the change in the response variable is the explanatory variable.
Exercises
For each question, identify the independent and dependent variables, and determine if there are any causal relationships, confounding variables, or common responses. Provide explanations for your answers.
Question 1
A researcher is studying the effect of fertilizer on plant growth. They apply different amounts of fertilizer to different plants and measure their growth after a month.
- Identify the independent variable.
- Identify the dependent variable.
- Independent Variable: Amount of fertilizer applied.
- Explanation: The researcher manipulates the amount of fertilizer to observe its effect on plant growth.
- Dependent Variable: Plant growth (measured after a month).
- Explanation: The plant growth is measured to see how it changes in response to different amounts of fertilizer.
Question 2
Scenario: A study is conducted to examine the relationship between the number of hours studied and the scores on a math test.
- Identify the independent variable.
- Identify the dependent variable.
- Independent Variable: Number of hours studied.
- Explanation: The number of hours studied is varied to observe its impact on test scores.
- Dependent Variable: Scores on the math test.
- Explanation: The test scores are measured to see how they change with different study durations.
Question 3
Scenario: A scientist is investigating the effect of temperature on the rate of a chemical reaction. They conduct the experiment at different temperatures and record the reaction rate.
- Identify the independent variable.
- Identify the dependent variable.
- Independent Variable: Temperature.
- Explanation: The scientist changes the temperature to see its effect on the reaction rate.
- Dependent Variable: Reaction rate.
- Explanation: The reaction rate is measured to determine how it varies with temperature.
Question 4
Scenario: A researcher is examining the relationship between physical activity and weight loss in a group of people. They track the amount of physical activity and the weight loss of each individual over six months.
- Identify the independent variable.
- Identify the dependent variable.
- Independent Variable: Amount of physical activity.
- Explanation: The amount of physical activity is observed to see its effect on weight loss.
- Dependent Variable: Weight loss.
- Explanation: The weight loss is measured to see how it changes with different levels of physical activity.
Question 5
Scenario: A study is conducted to determine if there is a relationship between smoking and lung cancer. The researchers collect data on smoking habits and lung cancer diagnoses.
Identify the independent variable.
Identify the dependent variable.
Determine if there is a potential causal relationship, and if confounding variables might be present.
- Independent Variable: Smoking habits.
- Explanation: The smoking habits are observed to see if they are related to lung cancer.
- Dependent Variable: Lung cancer diagnoses.
- Explanation: The diagnoses of lung cancer are measured to see if they are related to smoking habits.
- Causal Relationship: There is a potential causal relationship between smoking and lung cancer.
- Explanation: Smoking is known to cause lung cancer, but other factors (confounding variables) such as genetics and environmental exposure might also influence the relationship.
Question 6
Scenario: A researcher is studying the effect of a new drug on blood pressure. They administer the drug to one group and a placebo to another group, then measure the blood pressure of both groups.
- Identify the independent variable.
- Identify the dependent variable.
- Determine if there is a potential causal relationship and if any confounding variables need to be controlled.
- Independent Variable: Administration of the new drug or placebo.
- Explanation: The researcher controls who receives the drug and who receives the placebo.
- Dependent Variable: Blood pressure.
- Explanation: The blood pressure is measured to see how it changes in response to the drug or placebo.
- Causal Relationship: There is a potential causal relationship between the drug and blood pressure.
- Explanation: The drug might cause changes in blood pressure, but other factors such as diet and stress levels (confounding variables) should be controlled to ensure accurate results.
Question 7
Scenario: A study is conducted to examine the relationship between income level and educational attainment. Researchers collect data on individuals’ income and their highest level of education completed.
- Identify the independent variable.
- Identify the dependent variable.
- Determine if there is a potential common response variable that might influence both income and educational attainment.
- Independent Variable: Income level.
- Explanation: The income level is observed to see if it is related to educational attainment.
- Dependent Variable: Educational attainment.
- Explanation: The educational attainment is measured to see if it is related to income level.
- Common Response: Socioeconomic status could be a common response variable.
- Explanation: Socioeconomic status might influence both income level and educational attainment, creating a relationship between the two.
Question 8
Scenario: A researcher is investigating the effect of diet on cholesterol levels. They put participants on different diets and measure their cholesterol levels after three months.
- Identify the independent variable.
- Identify the dependent variable.
- Determine if there is a potential causal relationship and if any confounding variables need to be controlled.
- Independent Variable: Type of diet.
- Explanation: The researcher controls the type of diet that participants follow.
- Dependent Variable: Cholesterol levels.
- Explanation: The cholesterol levels are measured to see how they change with different diets.
- Causal Relationship: There is a potential causal relationship between diet and cholesterol levels.
- Explanation: Diet might cause changes in cholesterol levels, but factors such as age and physical activity (confounding variables) should be controlled to ensure accurate results.
Question 9
Scenario: A study is conducted to determine if there is a relationship between exercise frequency and mental health. Researchers collect data on how often participants exercise and their mental health status.
- Identify the independent variable.
- Identify the dependent variable.
- Determine if there is a potential causal relationship and if any confounding variables might be present.
- Independent Variable: Exercise frequency.
- Explanation: The exercise frequency is observed to see if it is related to mental health.
- Dependent Variable: Mental health status.
- Explanation: The mental health status is measured to see if it is related to exercise frequency.
- Causal Relationship: There is a potential causal relationship between exercise frequency and mental health.
- Explanation: Exercise might improve mental health, but factors such as stress levels and social support (confounding variables) should be considered.
Question 10
Scenario: A researcher is studying the effect of class size on student performance. They collect data on the number of students in a class and the average test scores of the students.
- Identify the independent variable.
- Identify the dependent variable.
- Determine if there is a potential causal relationship and if any confounding variables might be present.
- Independent Variable: Class size.
- Explanation: The number of students in a class is observed to see its effect on student performance.
- Dependent Variable: Average test scores.
- Explanation: The average test scores are measured to see how they vary with class size.
- Causal Relationship: There is a potential causal relationship between class size and student performance.
- Explanation: Smaller class sizes might lead to better student performance, but factors such as teaching quality and student socio-economic status (confounding variables) should be considered.
Conclusion
Now that we have established the idea of independent / explanatory variables and dependent / response variables, how can we get started in trying to determine if there is a relationship between the variables?
While there are several steps that would need to be done in order to prove this relationship, we will start down this road the same way we started down the road for single variables. We will ask questions, we will collect data, we will create visualizations for the data, and we will do some EDA to see if there could be a relationship. We will not go all the way to the end and firmly establish if there is a relationship. We will so some early analysis to see if we can easily rule out a relationship and the build up more evidence as we go.